Fintech
Redesigning Estateguru’s
investor portal
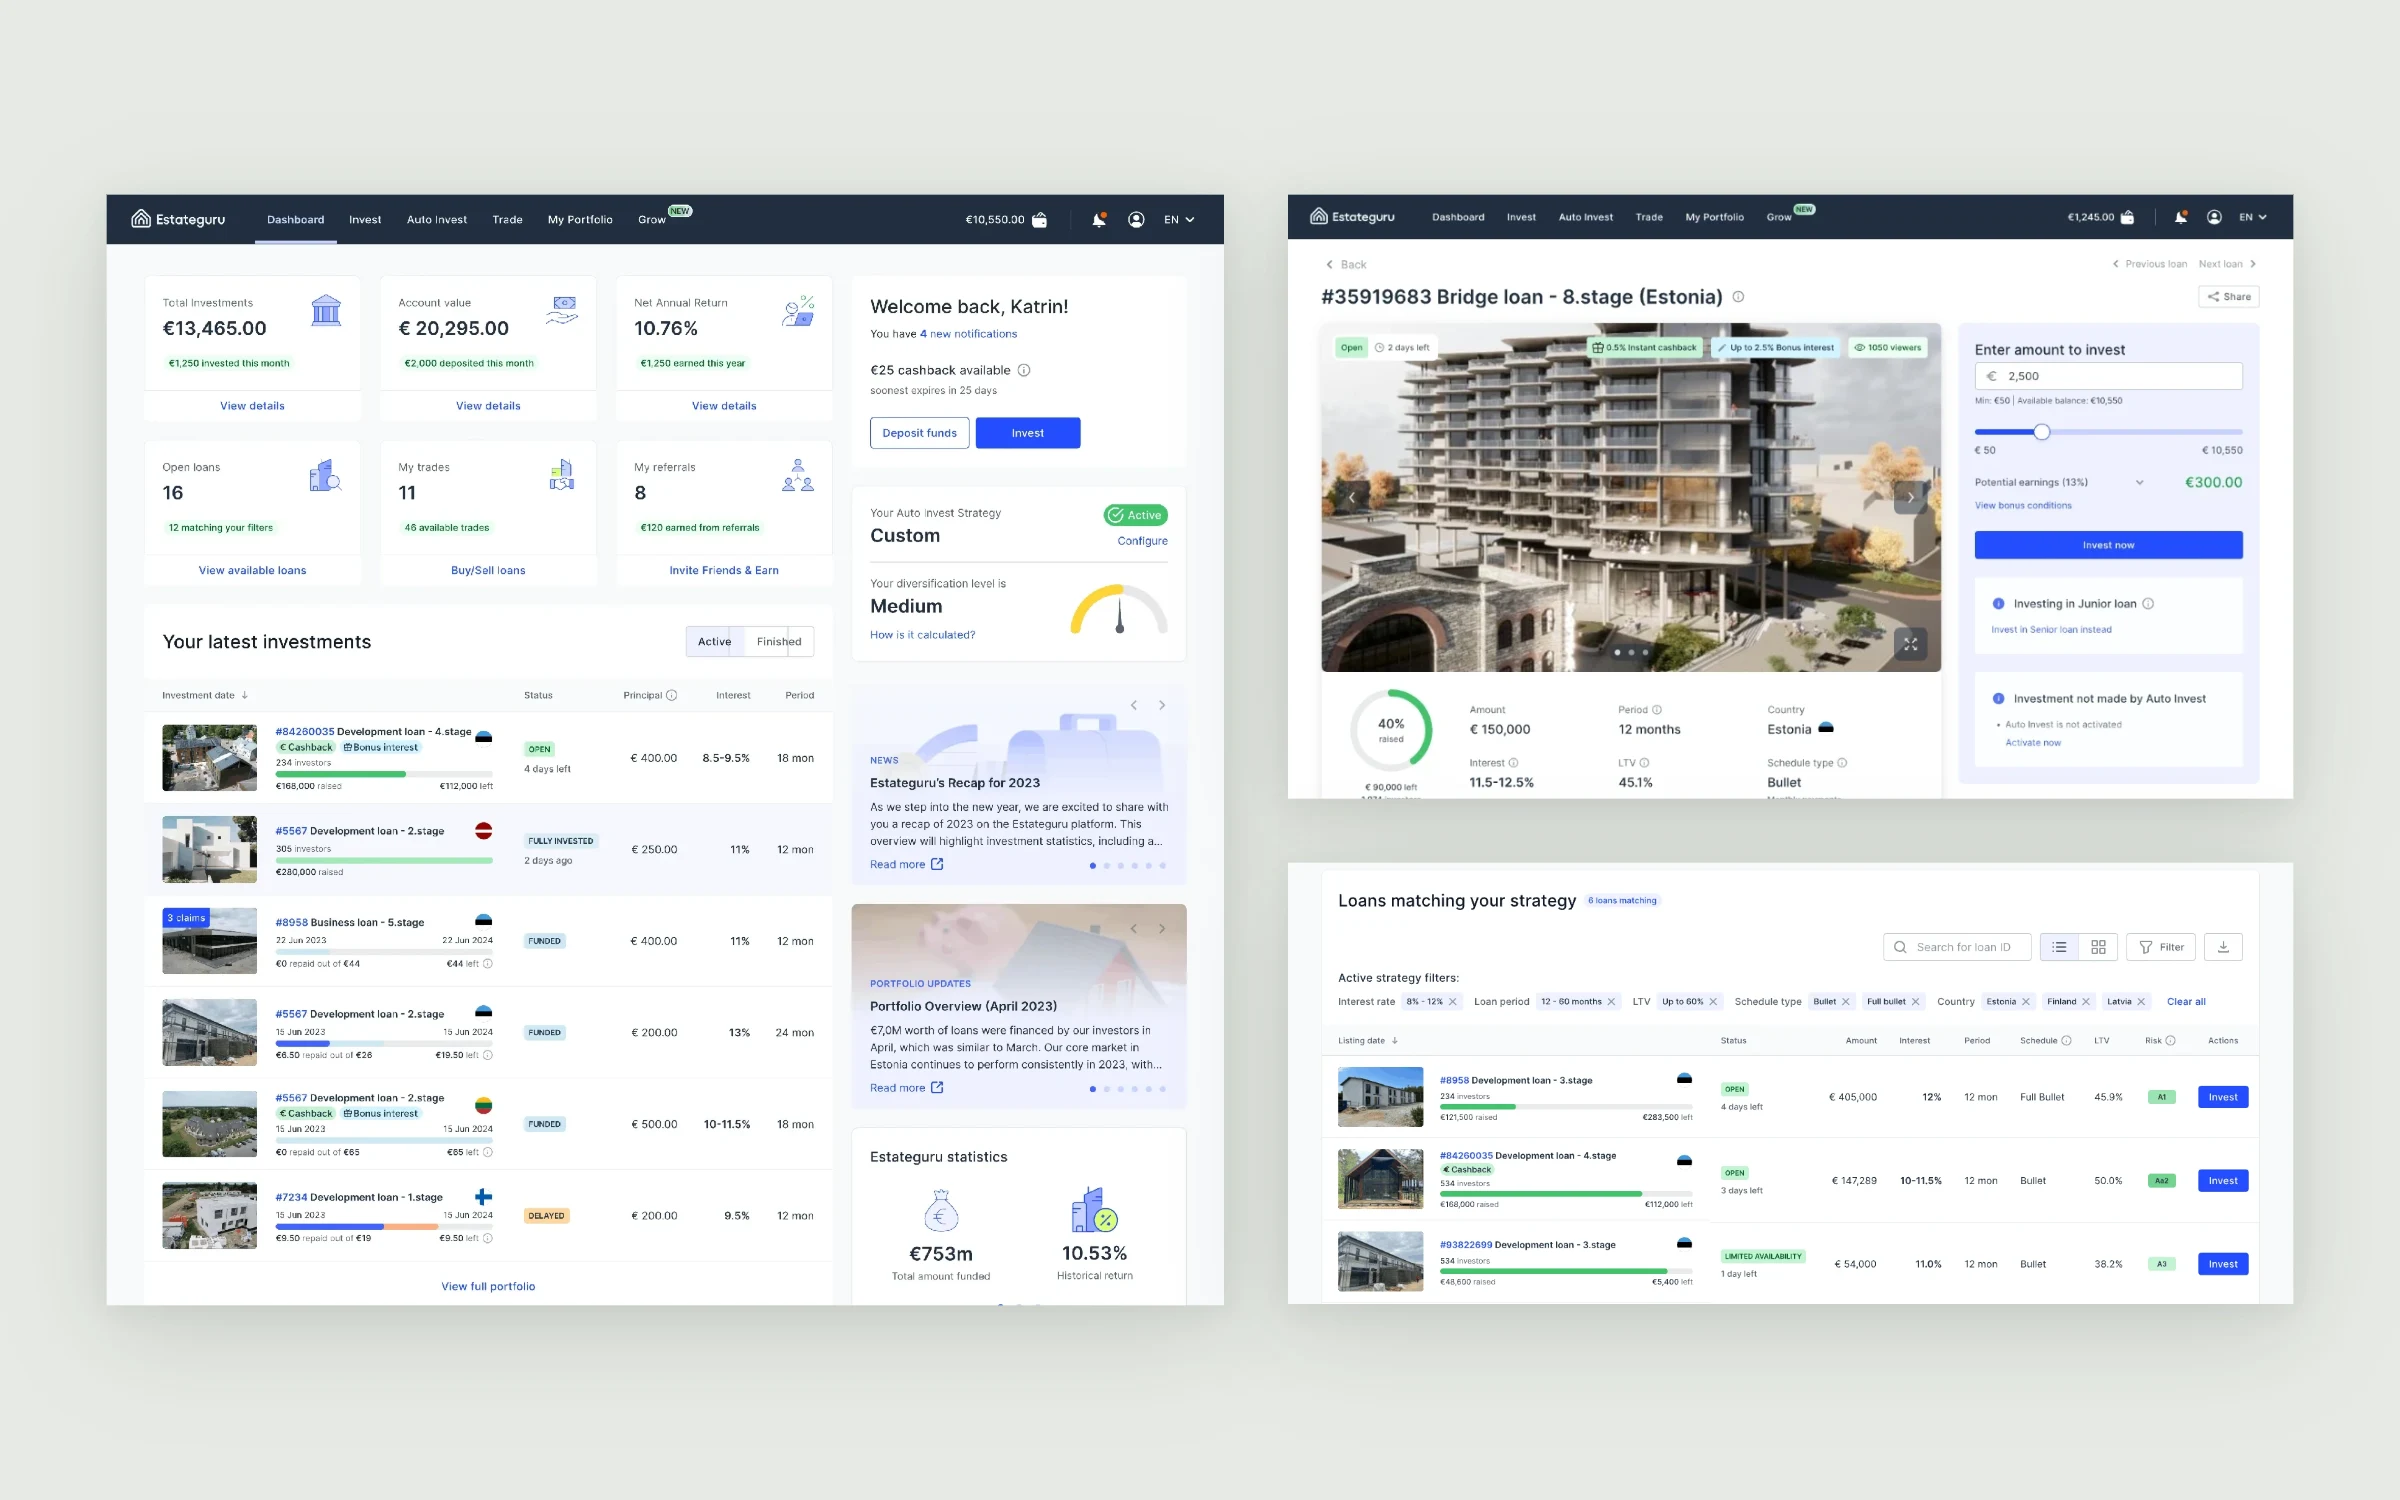
An end-to-end redesign of Estateguru’s web portal for real-estate loan investors. The scope covered portfolio tracking, manual and automated investing, funding and withdrawals, onboarding and account management, bringing fragmented journeys into a consistent experience across desktop, tablet and mobile.
Estateguru is a pan-European marketplace for property-backed loans, where individual investors fund real-estate developers. Visit Estateguru
The setup
The portal had grown. The mental model hadn’t.
Investment performance, loan details and account actions were spread across overlapping pages. The redesign also had to accommodate onboarding, identity checks, funding and a wider range of investor workflows.
I owned UX/UI design across information architecture, flows, screens, responsive variants and reusable components. I worked with the Frontend & Design Lead and distributed engineers through handoff, beta feedback, staged rollout and design QA.
Research
Looking past assumptions about what investors needed.
Before changing layouts, I wanted to see where the existing portal actually slowed people down. I combined three sources, so that what investors said, what they did and what they asked support about could be checked against each other.
Conversations with investors about how they track their portfolio, decide where to invest and manage funds.
Investors working through real tasks in the portal, which showed where they hesitated or had to look twice.
Support requests, product analytics and an audit of the existing pages showed which questions and dead ends repeated at scale.
What we learned
The same four problems kept coming back across all three sources.
The portal did not lack information. The friction was knowing which figure mattered and what to do next.
Constraints we designed for
KYC, an investor questionnaire and a connected bank account had to be completed before anyone could invest.
160k+ investors across 8 countries used the same portal, so patterns had to hold for every market.
Desktop, tablet and mobile had to come from one component set, not three separate designs.
Changes reached investors through beta feedback and a staged rollout, built by distributed engineers.
How it shipped
From findings to a staged release.
- Research
Interviews, usability tests, support and analytics review.
- Information architecture
Clear homes for portfolio review, investing, funding and account tasks.
- Flows & UI
Screens and responsive variants built on the shared design system.
- Handoff
Component states and specifications reviewed with the Frontend & Design Lead and engineers.
- Beta
Investor feedback on the beta before a wider release.
- Rollout & QA
A staged rollout with design QA of the released areas.
Shipped scope
Three connected areas of the investor experience.
Released by the team across three product areas, each on desktop, tablet and mobile.
Investment journeys
Dashboard, My Portfolio, Manual Invest, Auto Invest, Trade, Invest and borrower pages.
Funding & withdrawals
Reworked Wallet, a reusable Add funds modal accessible across the portal, and a clearer withdrawal-to-bank flow.
Accounts & security
Settings, password recovery, two-factor authentication and reorganized account-creation flows for individual, company and borrower profiles.
Screens show placeholder names and figures. Outcome metrics weren’t available, so this case describes released scope, not measured impact.
Key journey · Onboarding
Let people explore before they can invest.
I shortened the initial registration flow so new investors could reach the Dashboard and browse opportunities before completing every verification step. Instead of hiding the product behind a long sequence, the Dashboard kept remaining requirements visible in a side panel.
View the Dashboard and available projects after a shorter initial onboarding.
Show outstanding tasks—bank account connection, KYC and an investor questionnaire—before investing is enabled.
Investor dashboard
A clear overview, with the next action in reach.
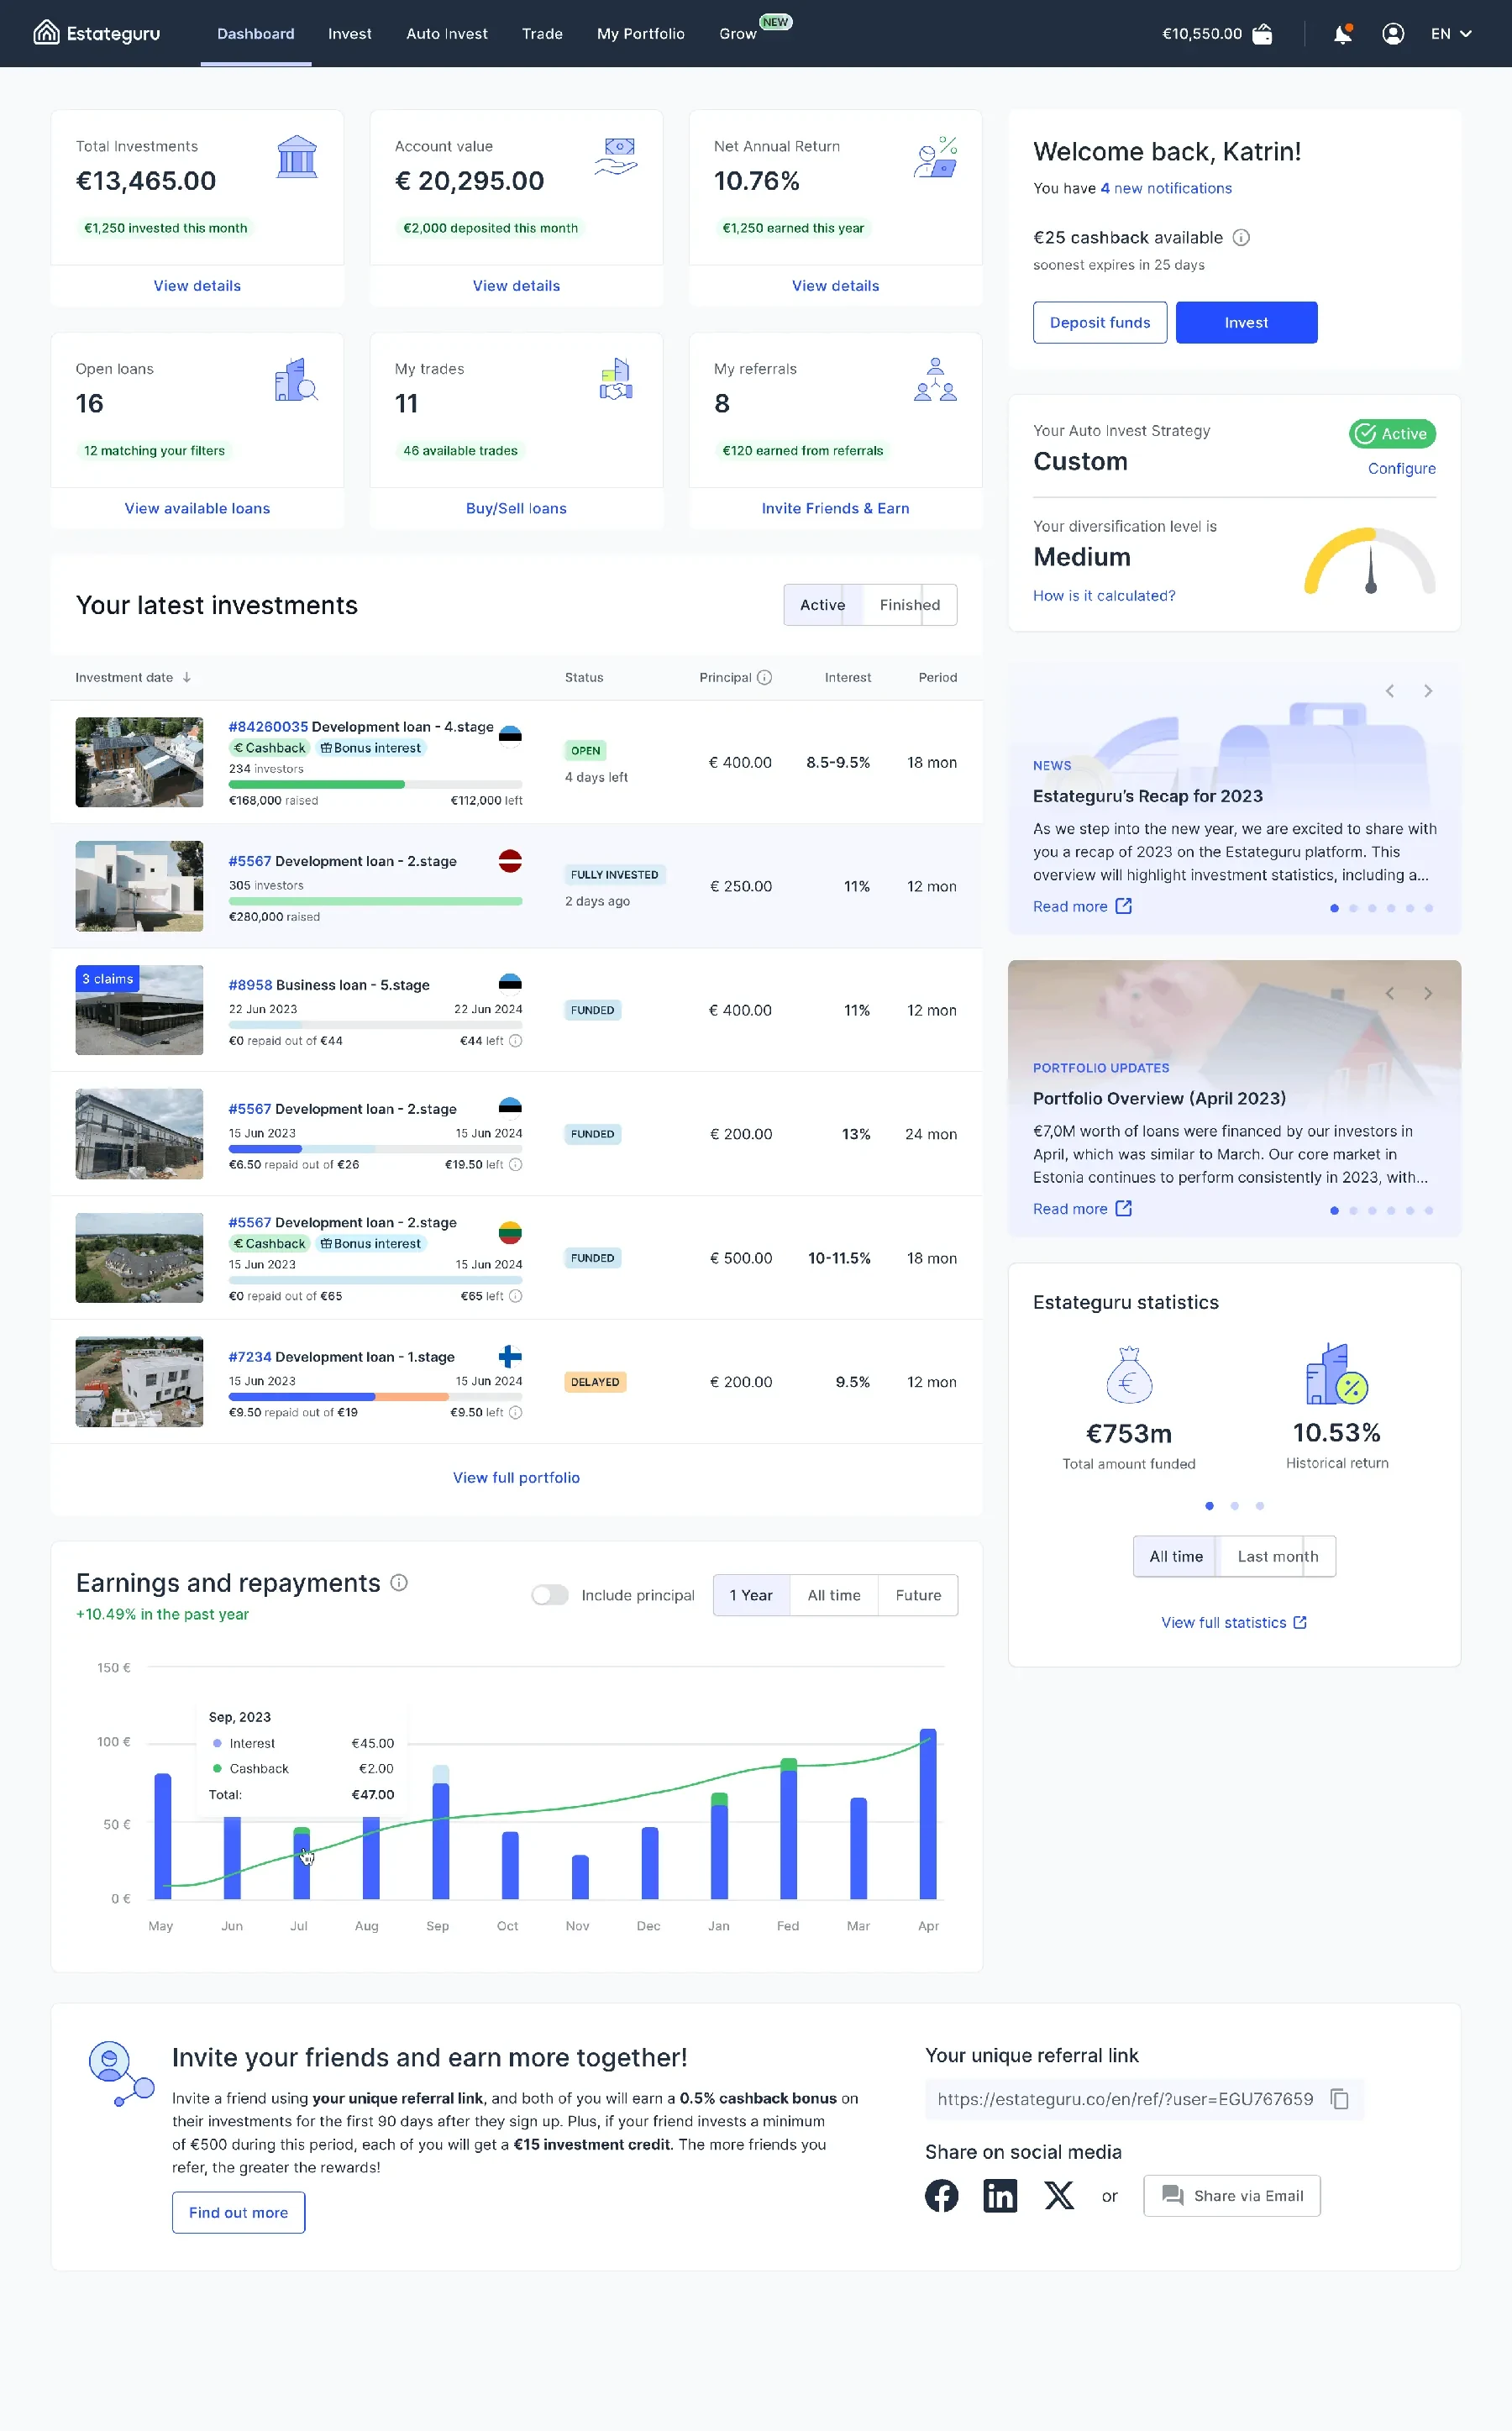
The dashboard brought account value, invested capital, returns and recent investments into one overview. Contextual actions led to the full portfolio, available loans and Auto Invest settings, keeping detailed workflows in their own sections.
Useful detail when it is needed
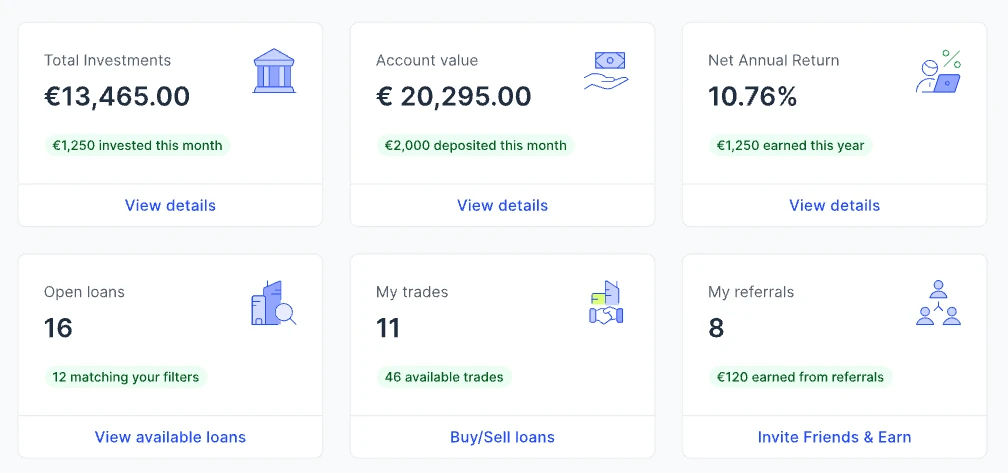
Financial cards could expand into breakdowns and time ranges, while action cards routed directly to relevant tools. I designed both patterns as reusable components.
Auto Invest, end to end
Automation that shows its work before and after it runs.
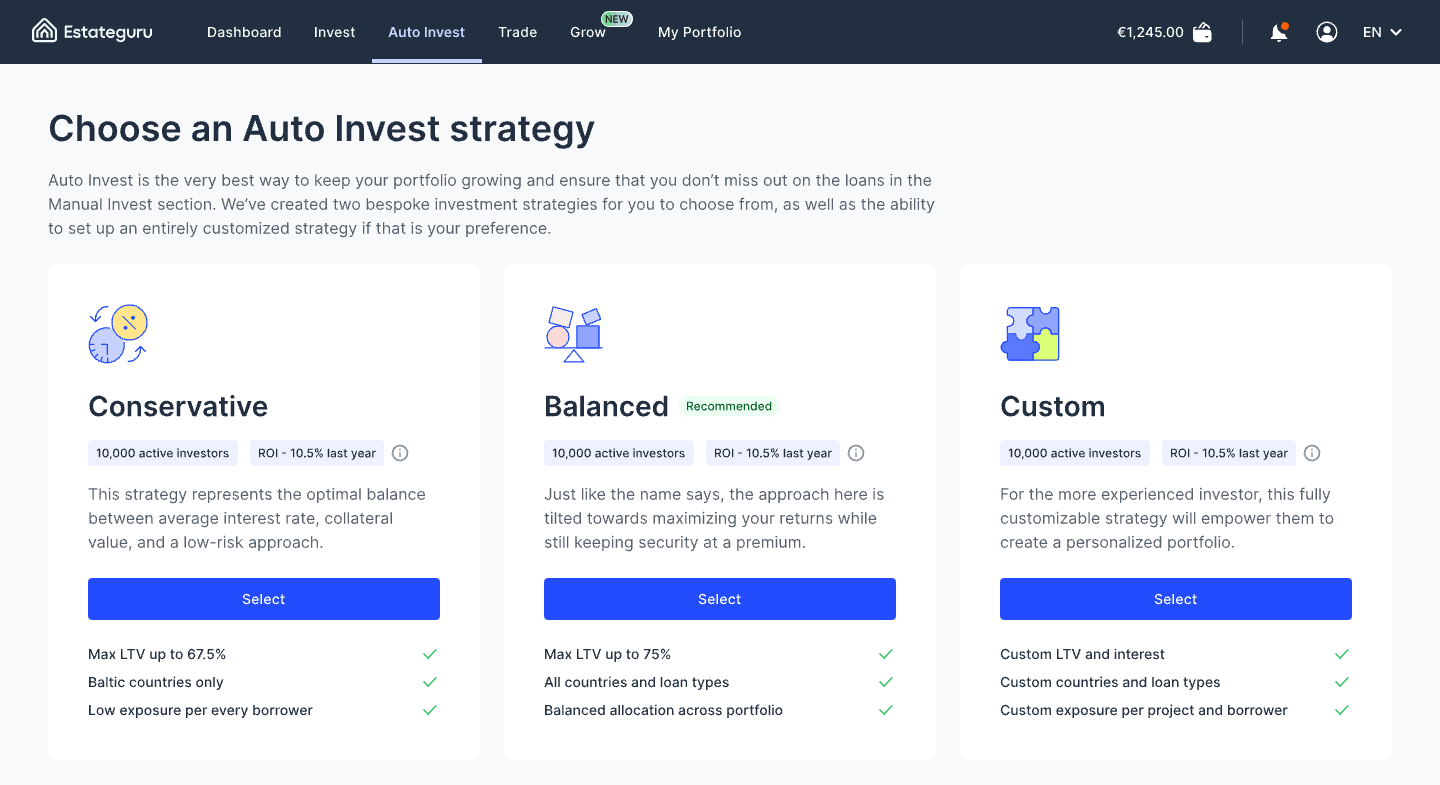
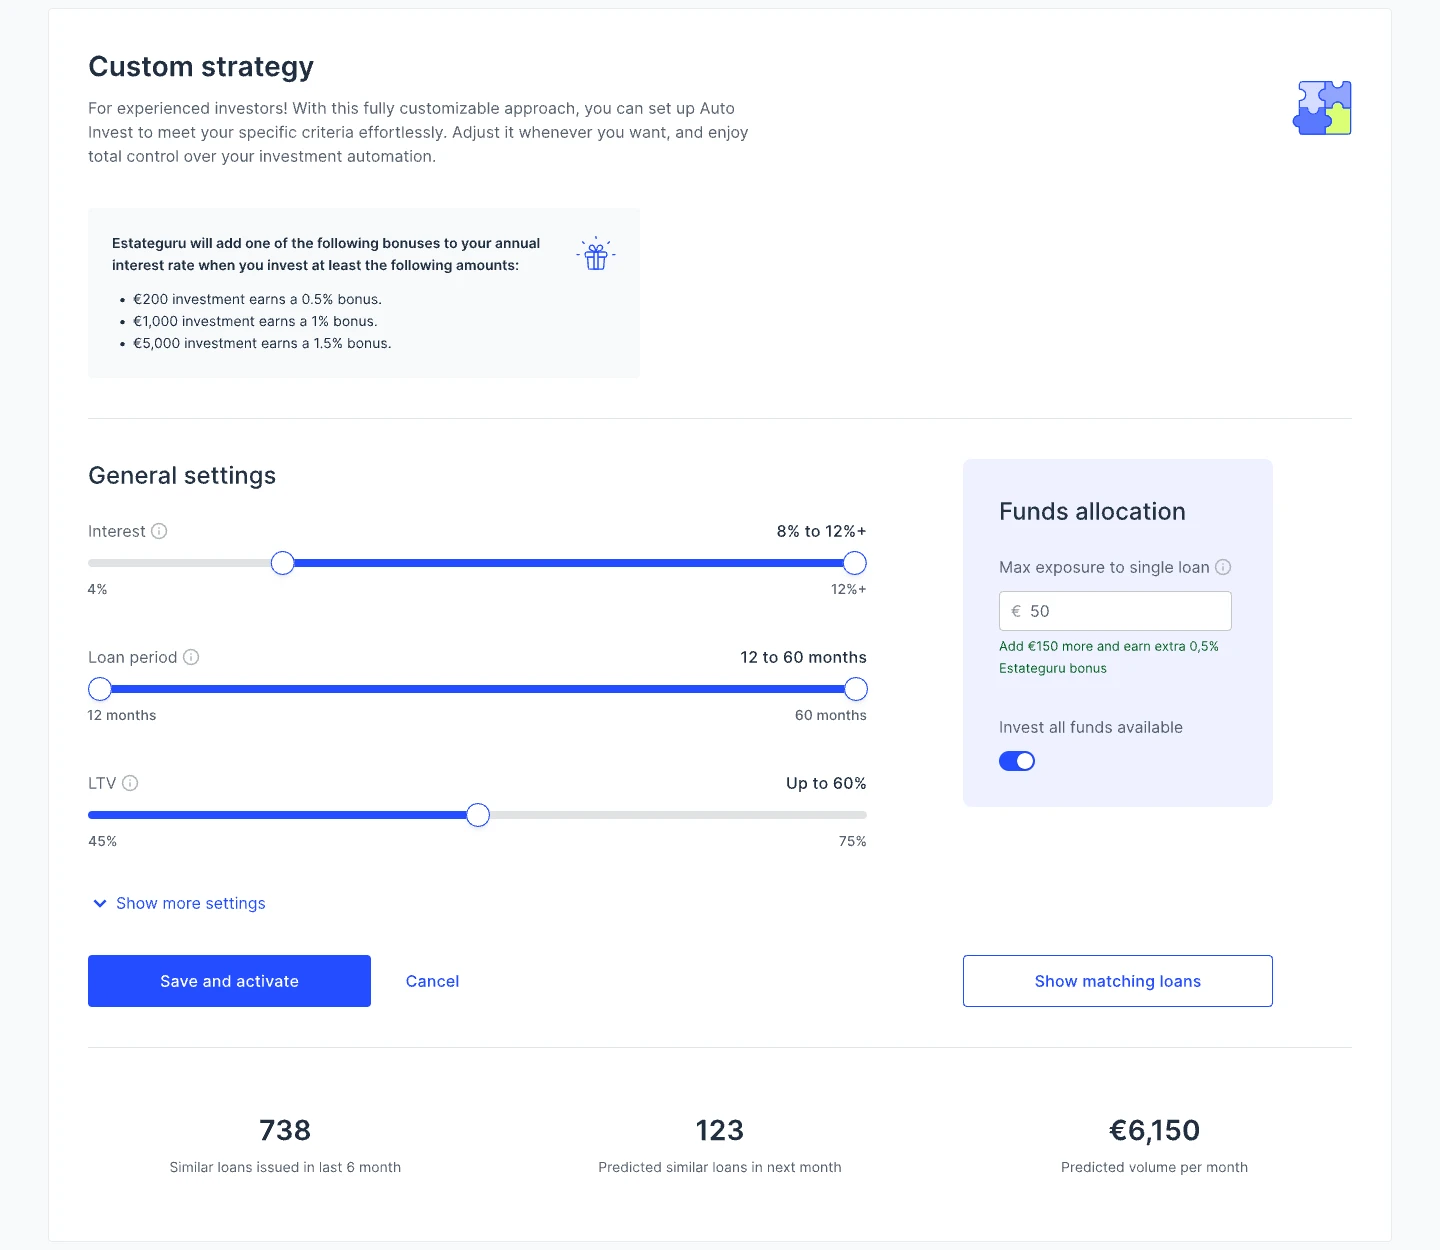
These screens show the whole flow, so an investor can see what a strategy will do before saving it and what it is doing afterwards.
Before saving: a forecast
The Custom strategy keeps the essential rules in view (interest, loan period and LTV ranges) and moves the rest behind “Show more settings”. A Funds allocation panel sets the maximum exposure per loan and points to the next bonus threshold. Before saving, a forecast shows how many similar loans were issued in the last six months, how many are expected next month and the predicted monthly volume.
Checking the result: matching loans
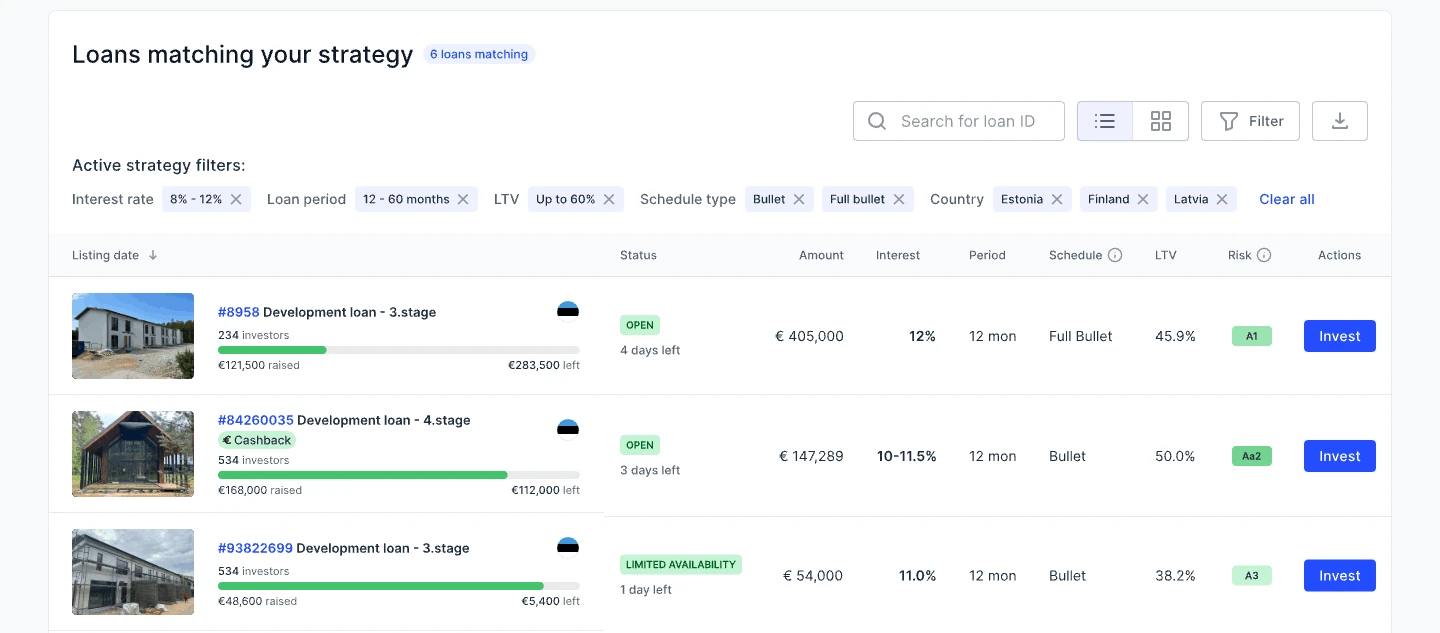
“Show matching loans” lists the loans the strategy would pick, with every active filter shown as a removable chip. Each rule is visible and can be undone, so it is clear why a loan is in the list.
After activation: always in view
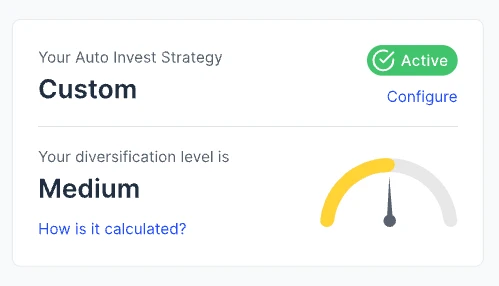
On the dashboard the strategy stays visible with its status and a Configure link, next to the portfolio’s diversification level and an explanation of how it is calculated.
Loans, explained
Every loan, from first look to last repayment.
Deciding on one loan
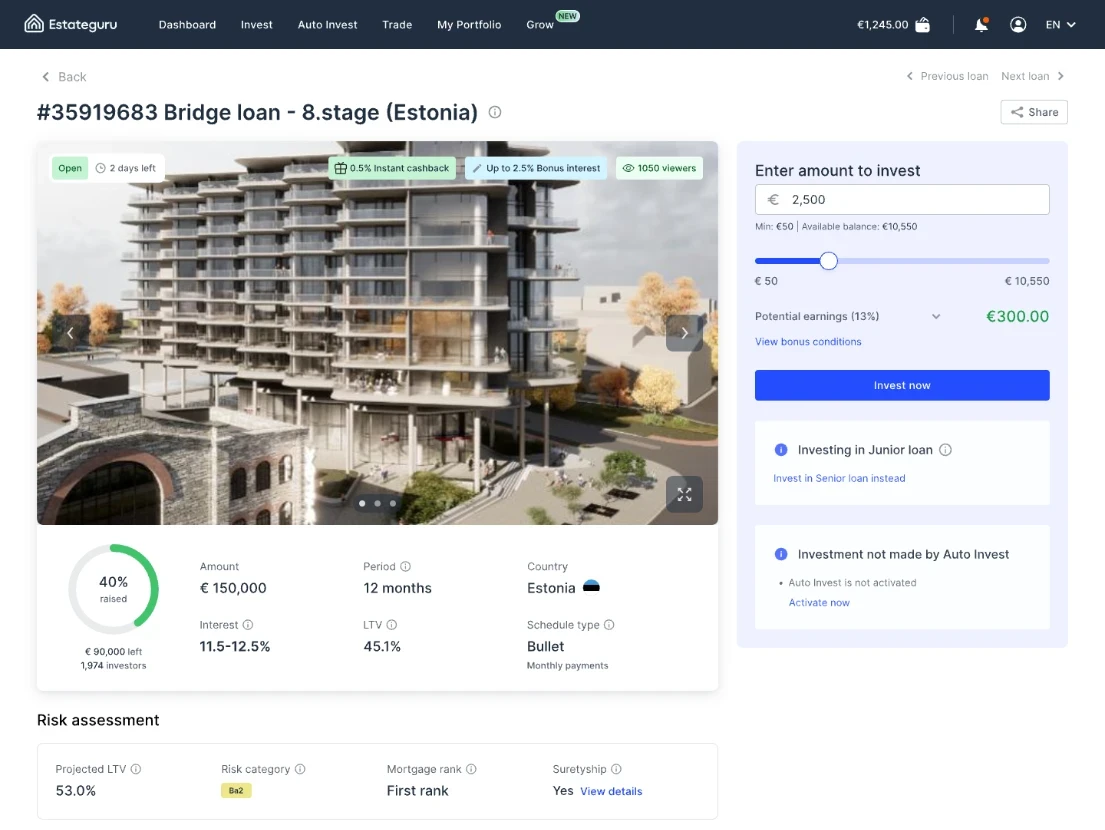
The loan page keeps the decision in one panel: the amount with the minimum and available balance, potential earnings at the loan’s rate, bonus conditions and the Invest button. Notes explain what is different about this investment, such as a junior loan with a link to the senior one, or a loan Auto Invest did not pick and why. On the left, the key terms (amount, period, interest, LTV, schedule and how much is raised) sit above a risk assessment with projected LTV, risk category, mortgage rank and suretyship.
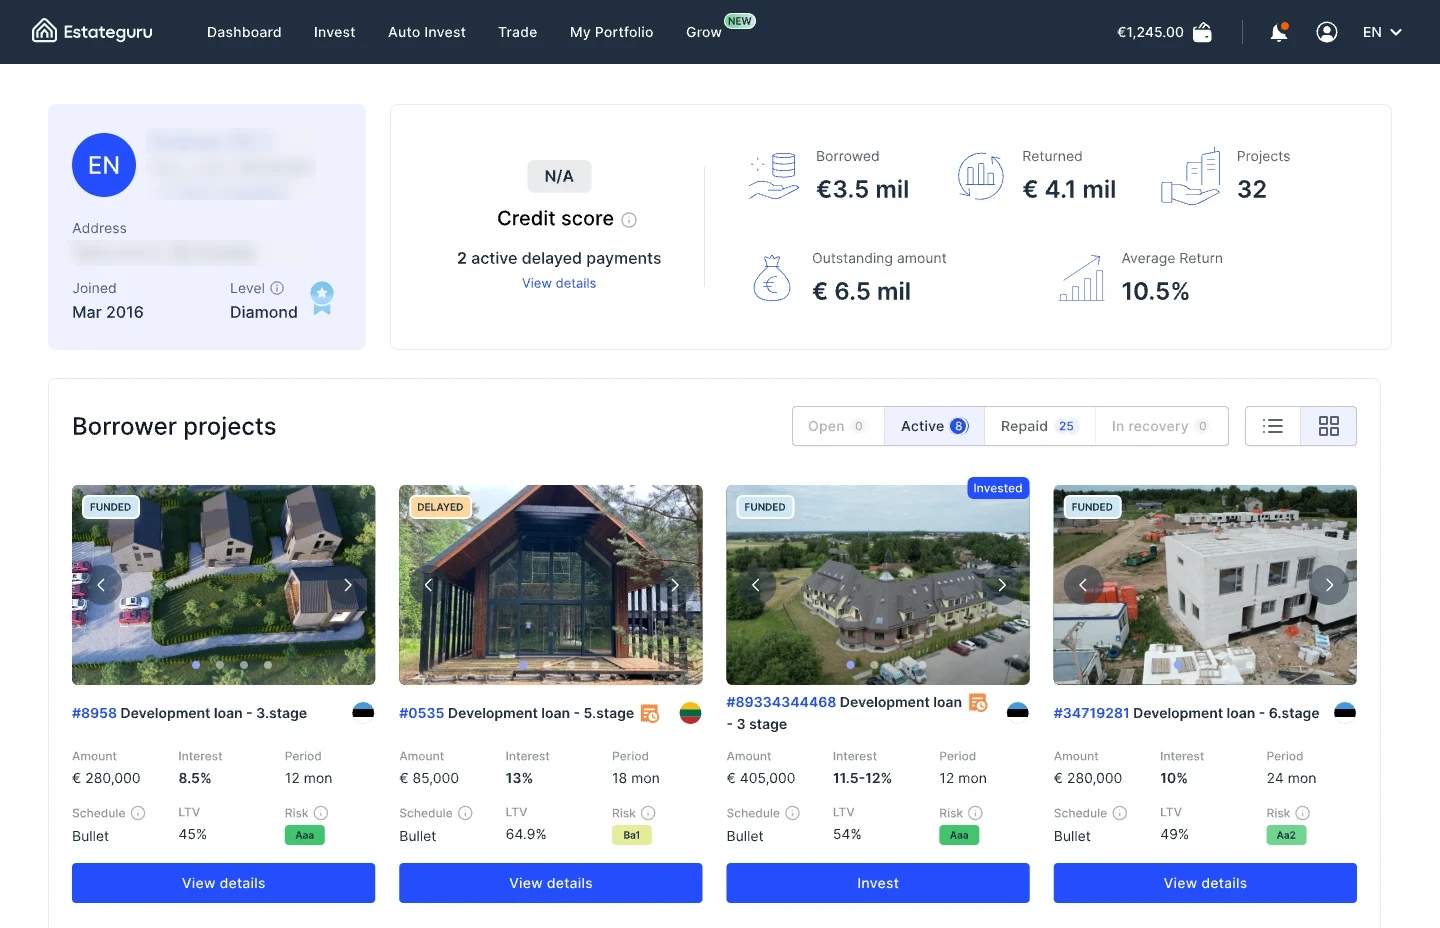
The borrower page answers who the money goes to: credit score, active delayed payments, amounts borrowed, returned and outstanding, average return and every project the borrower has run, filterable by Open, Active, Repaid and In recovery.
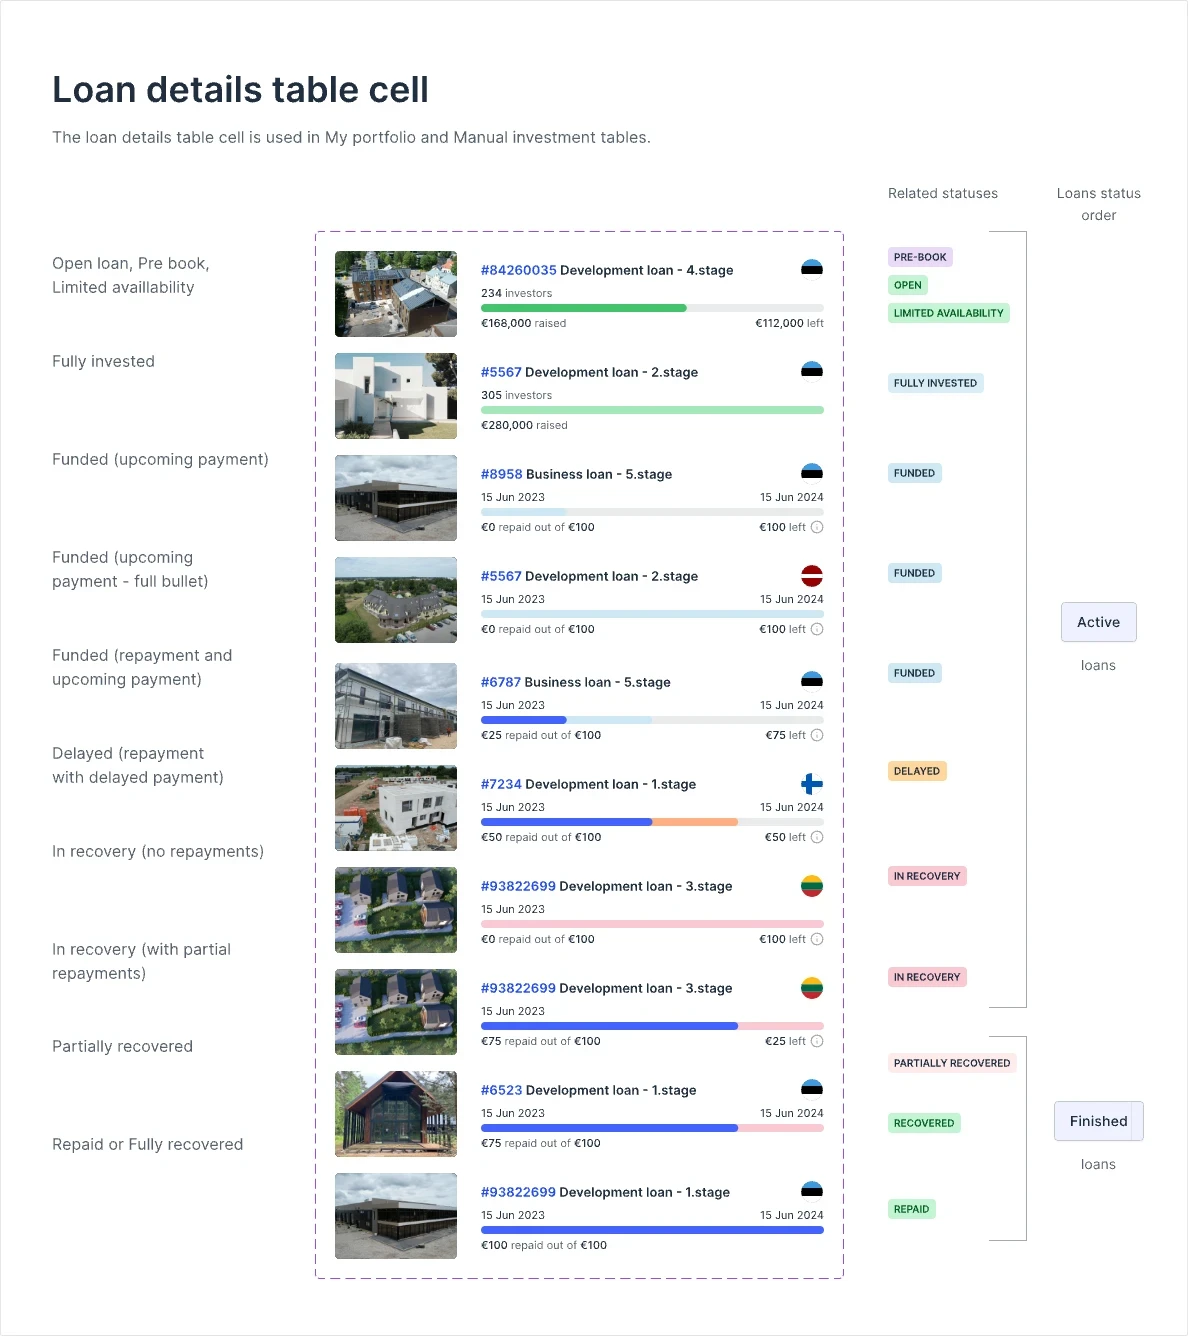
One loan cell, every status
My Portfolio and Manual Invest share one table cell. Its progress bar changes meaning over the loan’s life: money raised while the loan is open, then repayments once it is funded, with delayed amounts in orange and recovery in pink. Statuses follow a fixed order and split into Active and Finished loans, so a list sorted by status reads like a timeline.
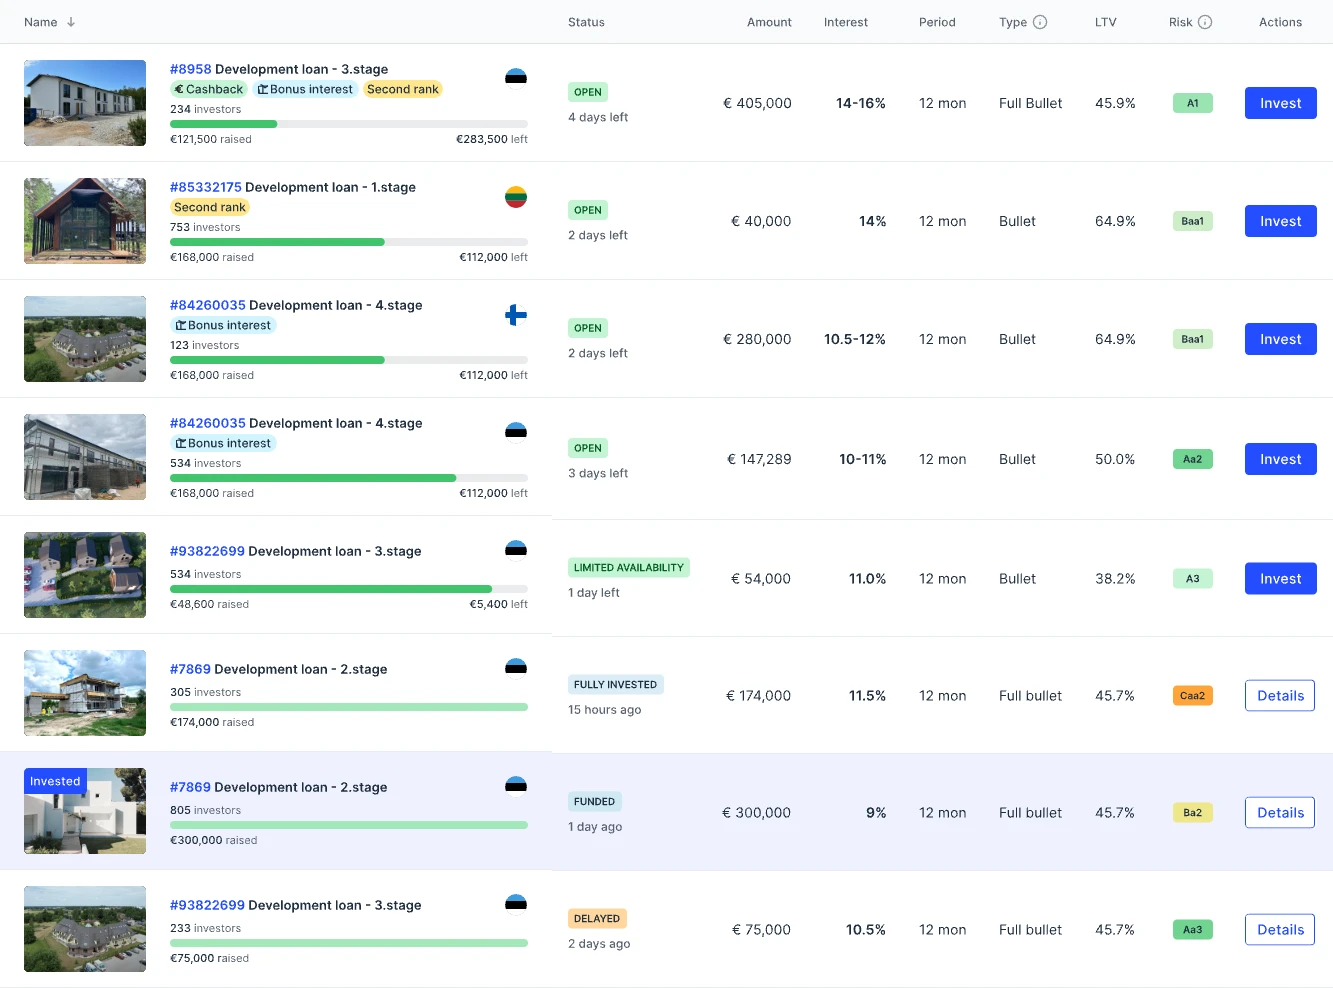
In Manual Invest the same cell sits in a full table and the action follows the status: Invest while a loan is open or in limited availability, Details once it is fully invested, funded or delayed. Tags such as Cashback, Bonus interest and Second rank flag what makes a loan different before it is opened.
States, not screens
The polished screen was the easy part.
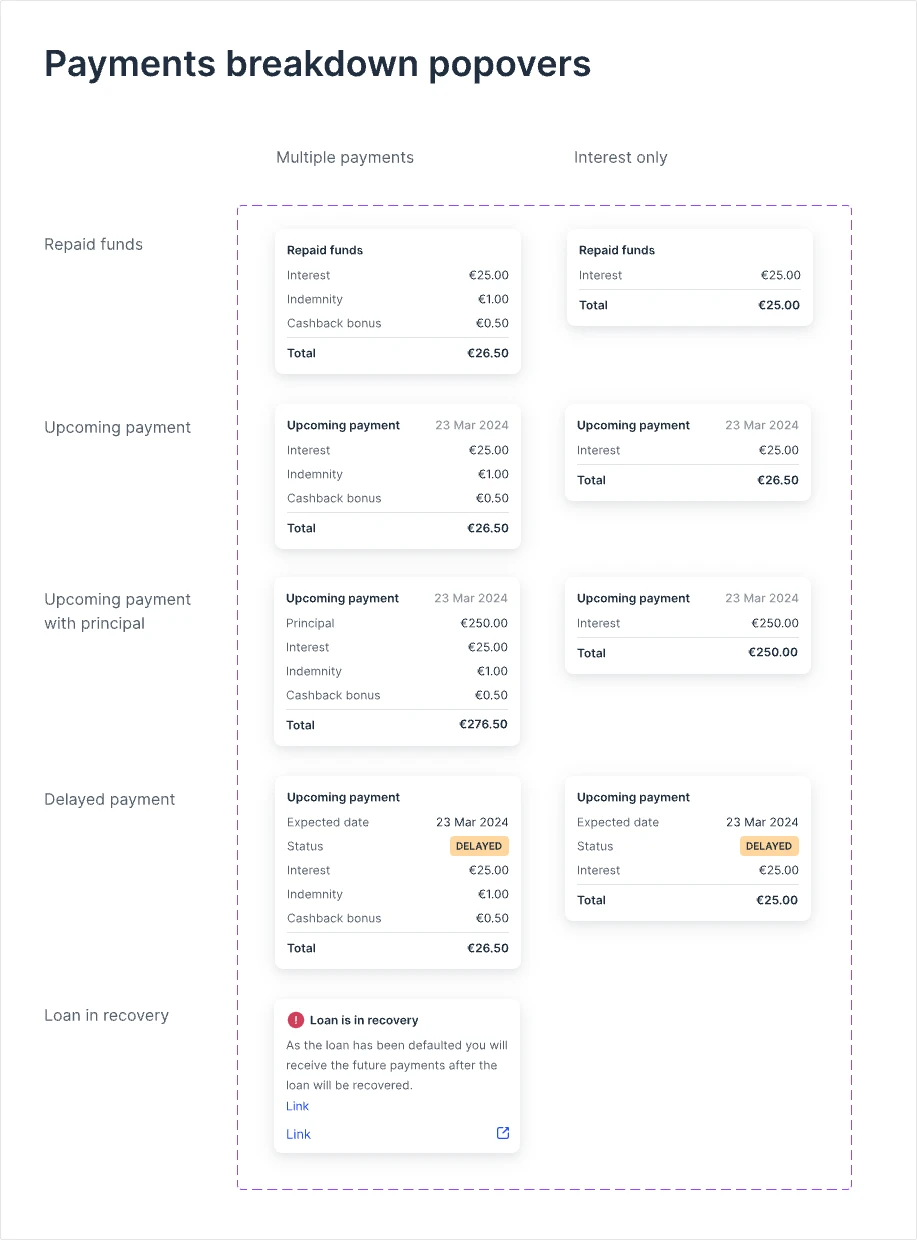
Beyond primary screens, I designed active and paused investment strategies, account requirements, loading and error states. The funding flow used a shared Add funds modal accessible across the portal, alongside the redesigned withdrawal journey.
Payments show how far this went: one popover pattern covers repaid funds, upcoming payments with and without principal, delayed payments and loans in recovery, for both regular and interest-only schedules.
Same model, less room
Mobile forced the hierarchy to prove itself.
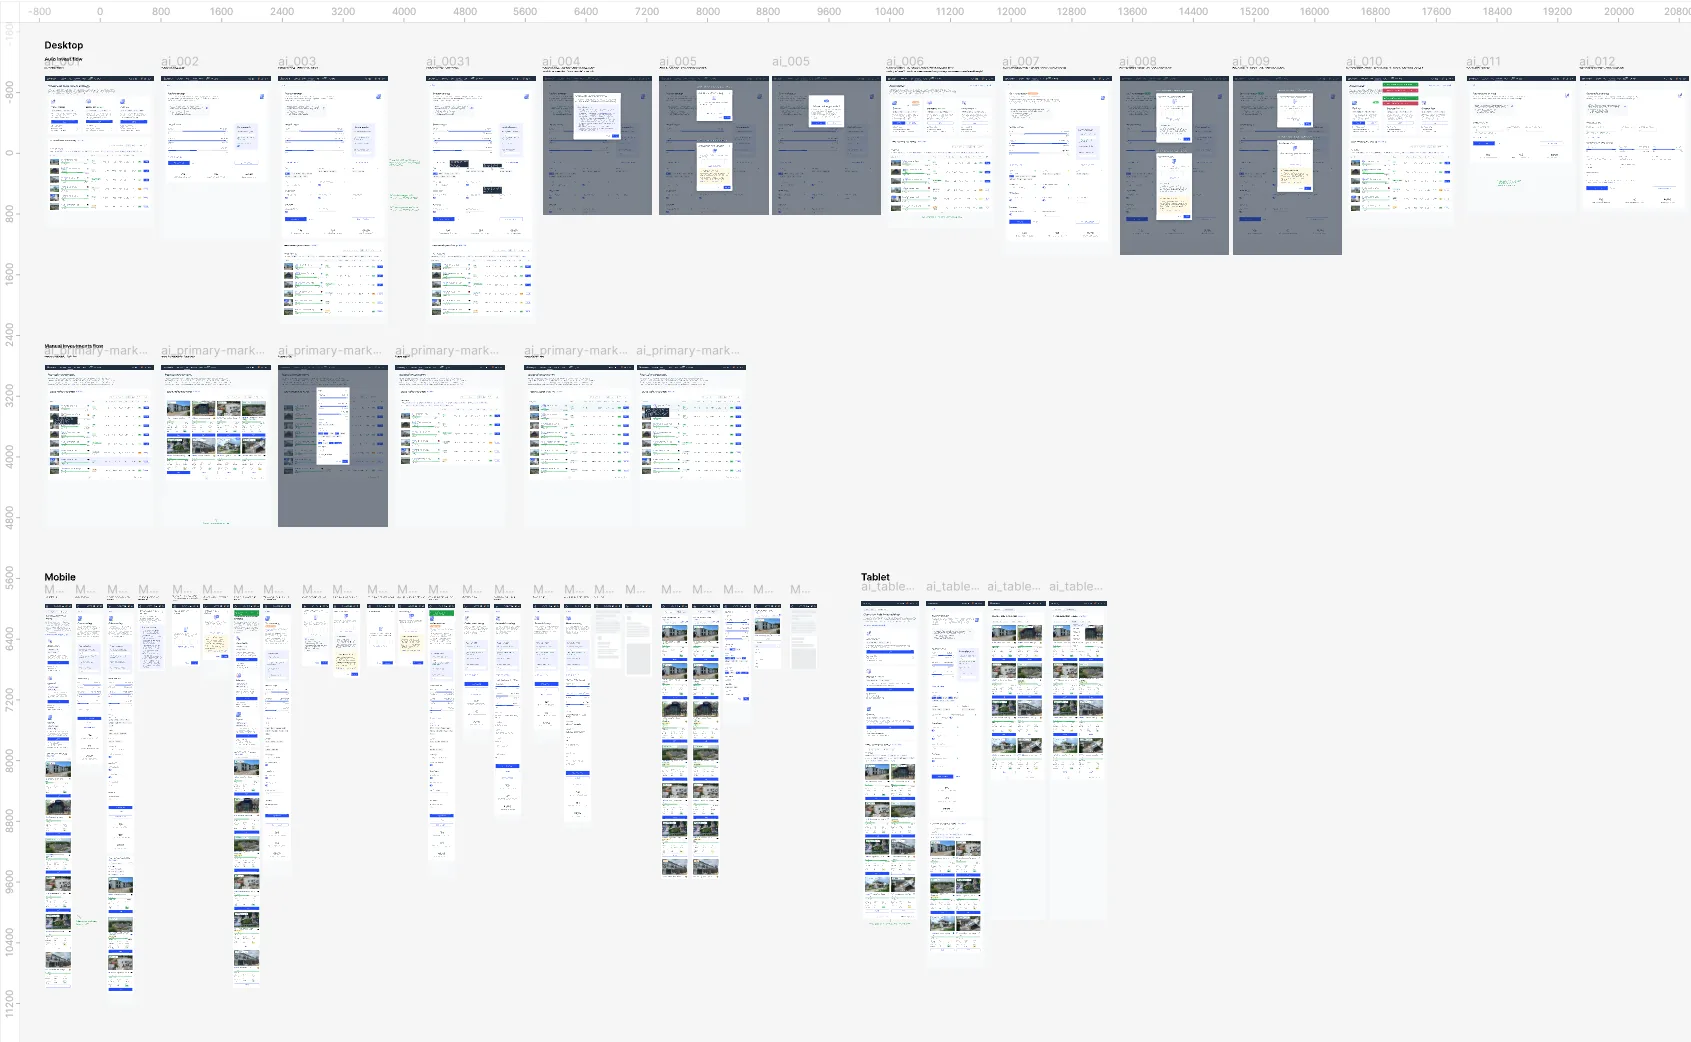
The earlier portal was desktop-focused. I redesigned its screens for desktop, tablet and mobile, adjusting component layouts, information density and actions rather than simply shrinking desktop views.
What changed
One set of rules could now carry more of the product.
Shared components and defined interaction states let the team ship the redesign across screen sizes without re-solving the same UI page by page.
Looking back
What I would measure next.
I would establish before/after usability measures for portfolio comprehension, finding late loans, completing funding and KYC tasks, and reaching the next investment action.
A clearer interface is a design decision; improved understanding and activation need evidence.